Activity
Activity
Execution history for commands and Jobs is stored by the Rundeck server. Execution history can be filtered and viewed inside the "Activity" page.
Filtering Activity
By default, the Activity page will list running executions and history recent executions. The page contains a filter control that can be used to expand or limit the executions.
The filter form contains a number of fields to limit search:
- Within: Time range. Choices include 1 day, 1 week, 1 month or other (given a start after/before to ended after/before).
- Job Name: Job title name.
- User: User initiating action.
- Filter: The node filter used . You can enter just one node name to see if was executed against that node or use the node filter formats. Refer to the User Guide - Node Filters Documentation.
- Ad hoc command: Command typed into the command bar or via
dispatch. - Result: Success or failure status.

After filling the form pressing the "Filter" button, the page will display executions matching the search.
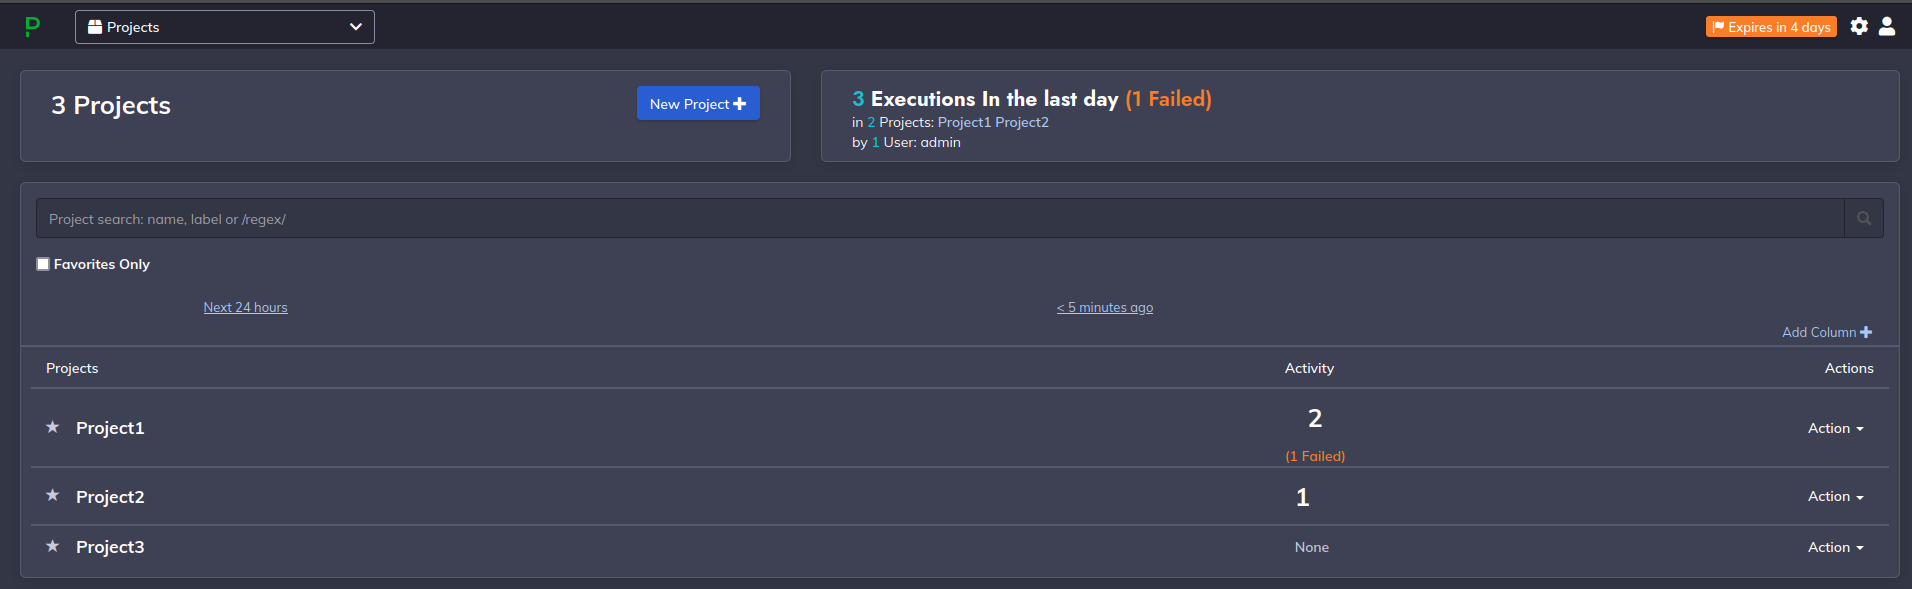
Activity in PagerDuty Process Automation On Premise's Home
On the home page, users can check activity for a specific project, such as failed executions for each project.
Note
Only the failed executions will display, excluding "missed" and other status.
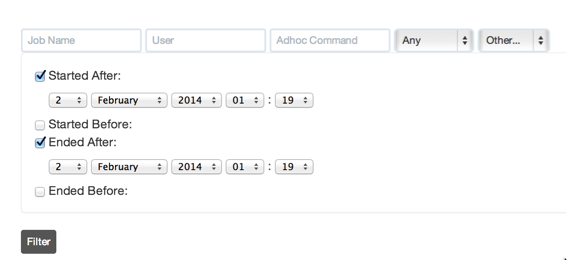
Extended date range
It is also possible to search for activity between dates. Press the "Other..." menu choice to bring up the form.
Saving the filter
Filters can be saved to a menu that makes repeating searches more convenient. Click the "save this filter..." link to save the filter configuration.
Execution listings
Information for each execution contains the command or Job executed, options, success status and a link to a file containing all the output messages.

If any errors occurred, the "Node Failure Count" column will show the number of nodes in red text. A bar chart indicates the percent failed.

You can find below the possible Execution Status an Execution can assume in Process Automation.
| Status | Icon | Colour | Description |
|---|---|---|---|
| SCHEDULED |  | Cyan | Status when a job is scheduled to be executed - Project Schedules (Enterprise). Project Schedules allow you to define Schedules independently of Jobs. Schedules can apply to any Jobs in the Project. Schedule definitions can be exported into, and imported from, Project Archives. |
| QUEUED |  | Blue | Status when Job Queue (Enterprise) is enabled and the job is queued. Job Queuing allow jobs to run a single execution at a time, but accepting new executions and placing them in a queue, to run them sequentially in the order they were created. |
| SUCCEEDED |  | Green | Status when the entire runbook was successfully executed on all nodes. |
| RUNNING |  | Cyan | Status when the runbook is being executed. |
| ABORTED |  | Grey | Status when the job execution has been aborted manually (GUI or via API) |
| TIMED OUT | | Orange | The execution of the job has timed out as per the definition |
| FAILED | | Red | Status when the execution of the runbook failed in one or more nodes - Dependent on settings and definition of failure |
| FAILED-WITH-RETRY |  | Orange | When the Job Retry Failed Nodes (Enterprise) plugin is enabled for a job, with retry options set, the plugin will review the previous execution's list of succeeded nodes and will just select on the next execution the nodes that either failed or were not started. |
| MISSED | | Red | Status when Missed Job Fires (Enterprise Only) is enabled and one of the jobs doesn't run at the time when it was scheduled to run. |
| OTHER-INCOMPLETE |  | Orange | Status when a job finishes with some nodes where some steps were not started |
| OTHER |  | ORANGE | Status when any other issue occurs during runbook execution |
RSS link
If configured, an RSS icon provides a link to an RSS view of the events that match the current filtering criteria.

Bulk Delete Executions
Tips
Old executions can be bound to old workflows stored in database just for information purposes, as a better practice, we recommend to clean periodically old executions in order to avoid slowness in the GUI or other problems related with the excesive amount of old records in the database.
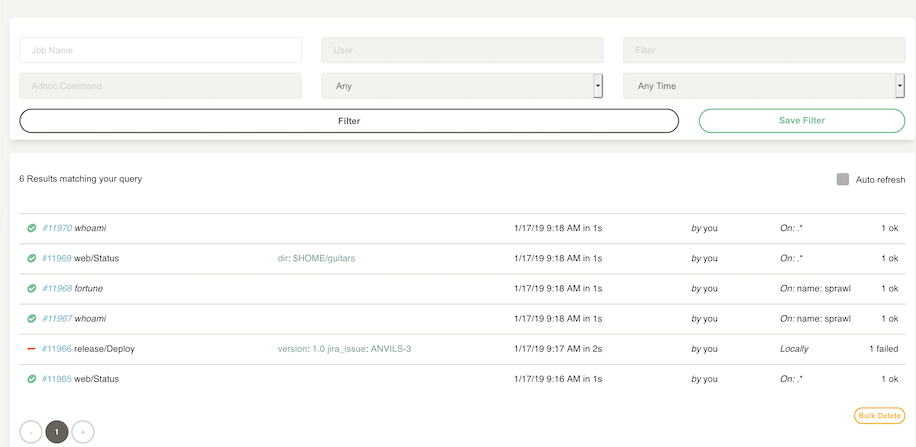
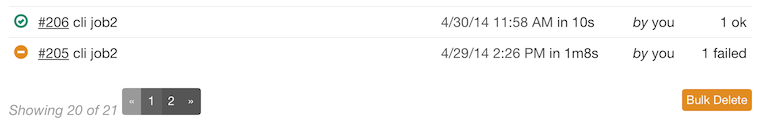
If you have access, you can click the "Bulk Delete" button to enable bulk-edit mode.
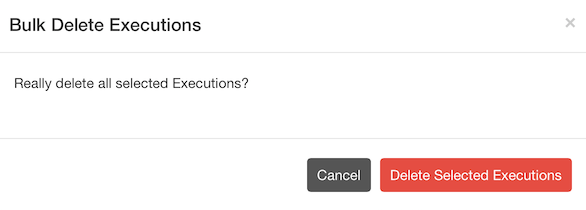
Select the Executions you want to delete by clicking on them. You can also click on the "Toggle all", "Select All" or "Select None" links to change the selection.
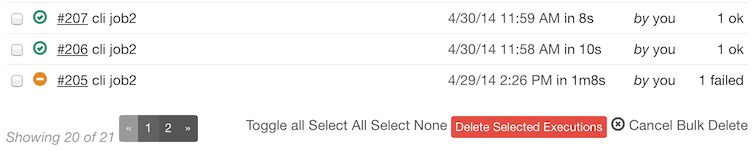
Click the "Delete Selected Executions", and confirm to delete the executions.